
GPU orchestration platform
DELIVERABLES
End-to-end product design for a pre-seed AI infrastructure startup:
-
Users flow
-
Information architecture
-
Wireframes
-
Role-based dashboards
-
A component library
TEAM OF 6
-
CEO/ product owner, Bay Area
-
Lead UX/UI Designer (myself), Bay Area
-
Front-end & Back-end Engineers, Romania
DURATION
-
March 2025- ongoing
TOOLS
-
Figma
-
FigJam
-
Slack
-
Google docs
-
Geminni
-
Claude
PROBLEM
60–70% of GPU compute budget wasted on idle resources. Organizations running AI workloads pay for GPU clusters that sit idle most of the day. Training clusters wait between jobs. Inference demand requires separate infrastructure. Engineering teams spend months building and maintaining custom tooling.
SOLUTION
Nucleaton™ solves this by converging training and inference on the same cluster, dynamically shifting idle GPU capacity to live inference workloads in real time. No other platform does this. It is C-Gen.AI's core differentiator.
PROJECT CYCLE
This was a proof-of-concept solution that was not connected with real data sources. The project turnaround was very quick. I did not interact directly with the clients but built prototypes based on input from the product management team that worked with sales. The entire design cycle was completed in 2 weeks, followed by a week for the development team to build and present.
OVERVIEW OF DASHBOARDS & DATA SOURCES

TARGET USER NEEDS
Due to limited direct user interaction (no design thinking sessions or interviews), I relied on client documentation and discussions with team members to understand user needs. This approach provided sufficient information to document the requirements of the three primary user groups:

Needs
-
Real-time monitoring of occupancy and energy usage.
-
Smart tracking, scheduling, and managing maintenance requests.
-
Predictive maintenance alerts to prevent equipment failures.
Responsibilities
-
Oversees cleaning and maintenance teams.
-
Ensuring all campus spaces (classrooms, labs, libraries, etc.) are well-maintained.
-
Ensuring the health, safety, and well-being of the building's occupants.
Challenges
-
Poor communication between shifts leads to difficulty in prioritizing work and locating staff.
-
Inefficient processes, like limited "grab and go" supply options, also hinder productivity.
-
Lack of standardized procedures for special events and insufficient communication between shifts can lead to unnecessary cleaning efforts and overall inefficiency.
NTT Data Solution
-
Occupancy analysis
-
Uniform recognition
-
Smart scheduling
-
Mobile ordering


How Might We effectively present critical data to empower IT Executives, Security Officers, & Facility Managers for rapid situational awareness, informed decision-making, and proactive issue resolution into a single, unified platform?
DASHBOARDS DESIGN
Seven Proof-of-Concept dashboards were designed for the Singapore sales team. The UI emphasized a clean, intuitive design with a focus on data visualization. Key considerations included clear data labeling, consistent color schemes, and the use of interactive elements to allow users to explore and analyze data easily.
This All Locations Dashboard allows IT Executives to navigate all University locations' command centers.


PERSONA-DRIVEN DESIGN SYSTEMS
I built a Mobile First & User First component library of light and dark themes in UXPin, aligning with NTT's design system and also drawing inspiration from Google's Material Design guidelines.
Goal
-
To develop and release the PoC quickly and test it with the users before committing to a large budget or resources.
-
Bridges the gap between design and development, allowing teams to collaborate more effectively.
Built for specific Personas
Executive
Require higher-level information across all areas/stores/offices, performance indicators (KPIs) and metrics.
Manager
Overview of operations: Dispatch, store supervisor, office manager/receptionist, the plant supervisor.
Operator
See “what is happening now”: Police or security officers, Shift/Floor management, etc.

Responsive dashboard, fitting different screen sizes.

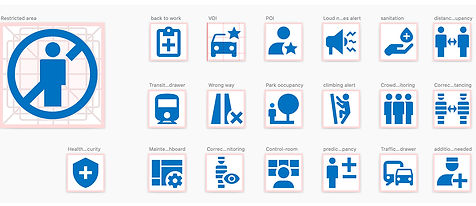
Designed standard iconography that has been used across dashboards.
To allow quick prototyping and delivery, I've designed several dashboard layouts.

Components for Events, Alerts, violations

Components for Area Occupancy

Statistic cards


Charts - data change over time


Design Library was constantly evolving. Went through many usability testing and feedback loops that helped ensure that the design system remains relevant and effective.
Converting Desktop components to Mobile


LEARNINGS & CONCLUSION
This was an unusual project for me to develop the designs that will not ultimately be used by the end user and in such a short time frame. I am not privy to the actual outcome of the sales process with the client. My association with the project was complete in 2 weeks.
Here is a summary of my learnings:
-
As a designer, I heavily rely on interacting with end users to empathize with them. In the absence of that opportunity, I had to attune to the general function & use case and, at times, use internet research to build a viable and useful design.
-
Time is a significant constraint in many real-world settings. While ideally, we want our designs to be perfect in every way, sometimes trade-offs are necessary to deliver quickly.
The product and sales teams were impressed with the output. Because the user did not deploy or test the design, I unfortunately do not know if significant issues or improvements were needed.