Car Racing Stadium Surveillance Web App
DELIVERABLES
-
Persona definitions
-
Data & Information Architecture
-
Low & high fidelity mockups
TEAM
-
Lead UX/UI Designer (myself)
-
Engineering Manager
-
Product Managers
-
Front-end & Back-end Engineers
DURATION
-
2 months & ongoing
TOOLS
-
UXPin
-
Miro
-
Teams
-
Slack
Sector
Sports and Entertainment, Live events
Business Need
The current monitoring system for venue management is inefficient and does not provide the reporting and insights needed to improve wait times and remediate congestion.
Solution
Consolidate disparate real-time data inputs and a predictive engine through real-time, visually intuitive dashboards for simple command and control over venue management and security.
Iterative Improvements over four years
The cycle of this project was somewhat unusual. We worked with the client iteratively to design, build, test, and deploy versions of this dashboard, receive feedback from end users, and improve it to be more effective and useful.

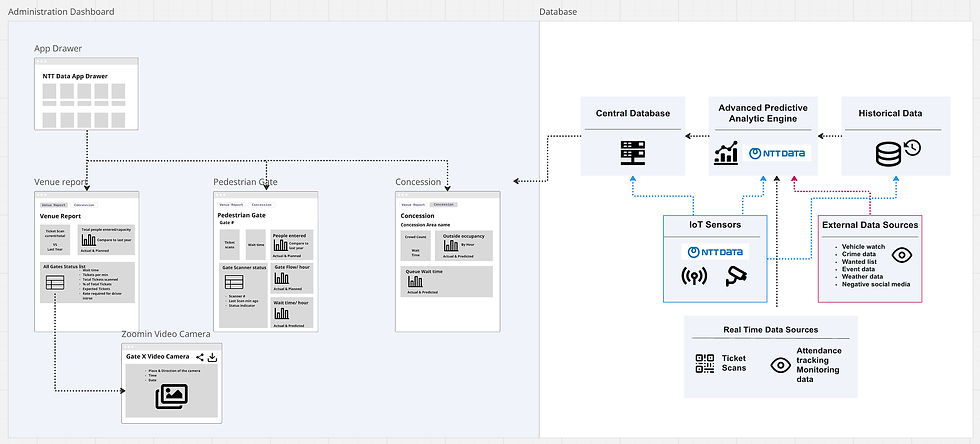
Predictive Modeling for Real-Time Intelligence.
A major aspect of this project was the predictive modeling feature driven through machine learning algorithms.
The diagram below illustrates the data architecture and how different systems interact.
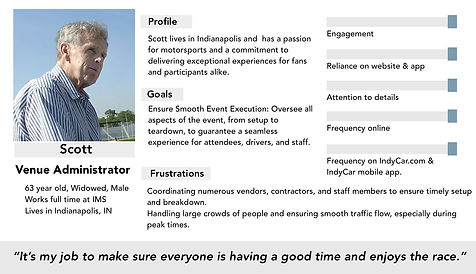
Persona Definition
We interviewed client representatives about various aspects of their work, their goals, aspirations, and frustrations. Through that, we developed fictional personas based on experience and assumptions.
I documented 2 different personas whom we identified as the primary users - Security personnel & Venue Administrators.


"How can we combine real-time monitoring & predictive analytics to optimize crowd flow, enhance fan experience, and mitigate potential safety risks?"
Evolution of IndyCar Surveillance Dashboards
2020
Initial version built using Grafana (prior to project kickoff)


Issues/Concerns: Complexity, slow performance, and weak security
2021
Version 1: Responsive web application with four separate dashboards
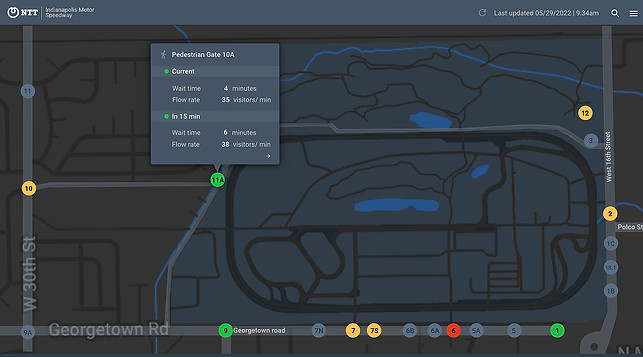
Gate Map (#1): Map with Pedestrian & Vehicle gates showing curent and predicted wait and flow rate.

Stadium health Dashboard (#2) : Shows estimated wait times, capacity and people & vehicle count per minute

Pedestrian Gates Report (#3) : Indicates status and information pertaining to each gate.
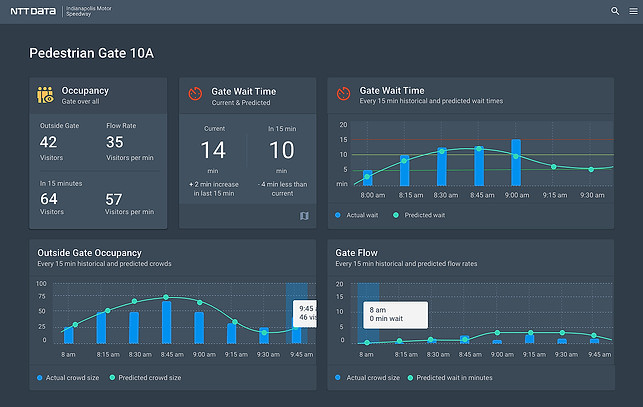
Gate Report (#4) :
Shows outside occupancy and flow rate/min along predicted with wait times
Client's feedback:
-
The overall layout is functional; Stadium & gate reports are the most used.
-
The vehicle count is not as helpful; we need a count of people in each car.
-
The headcount is not as helpful as it doesn't match the number of ticket scans.
2022
Version 2: Updated Stadium health dashboard (#2) as Venue dashboard with focus on ticket scans

Updated Venue Dashboard (#3):
-
Vehicle counts removed.
-
Main focus on actual, predicted history of ticket scans.
-
Added list of Gates & wait time (current and predicted)
Client's feedback:
-
The new venue report is much more helpful and less confusing without headcount information.
-
The components are heavy on text, and some of them are visually overwhelming, with a lot of information to process.
-
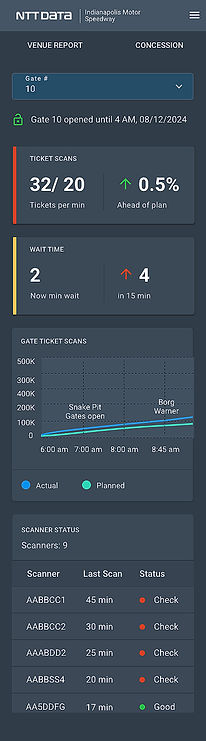
A mobile version is just a responsive web app, and it is not very user-friendly as the components were not developed for the mobile interface.s
-
The same kind of data on concession stalls will also help avoid congestion there.
2023
Version 3: The map report was removed, and a concession dashboard was added. Developed a new mobile interface with mobile-specific components.


Gate Report


Concession dashboard (#5): New dashboard to see occupancy and wait times in concession stalls
Client's feedback:
-
The concession dashboard is very helpful.
-
Need a feature to switch between gates in the pedestrian gate dashboard through a dropdown
-
Will be helpful to see live TV view when we hover over the gates
-
Will be helpful to navigate between the venue and concession view through tabs on the desktop
2024
Version 4: Gate filter feature, CCTV view on hovering, New compact design components, Mobile-friendly gate status table.
Updated Venue Dashboard to show CCTV view on hovering


Concession Dashboard


Gate Report
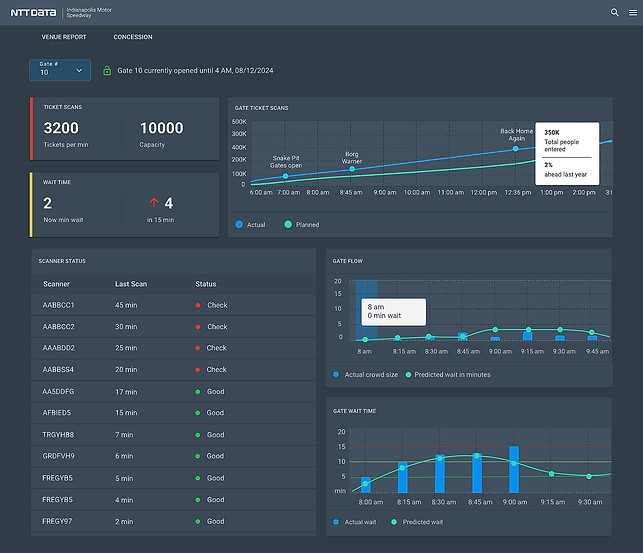
Updated Gate report with dropdown filter feature on top


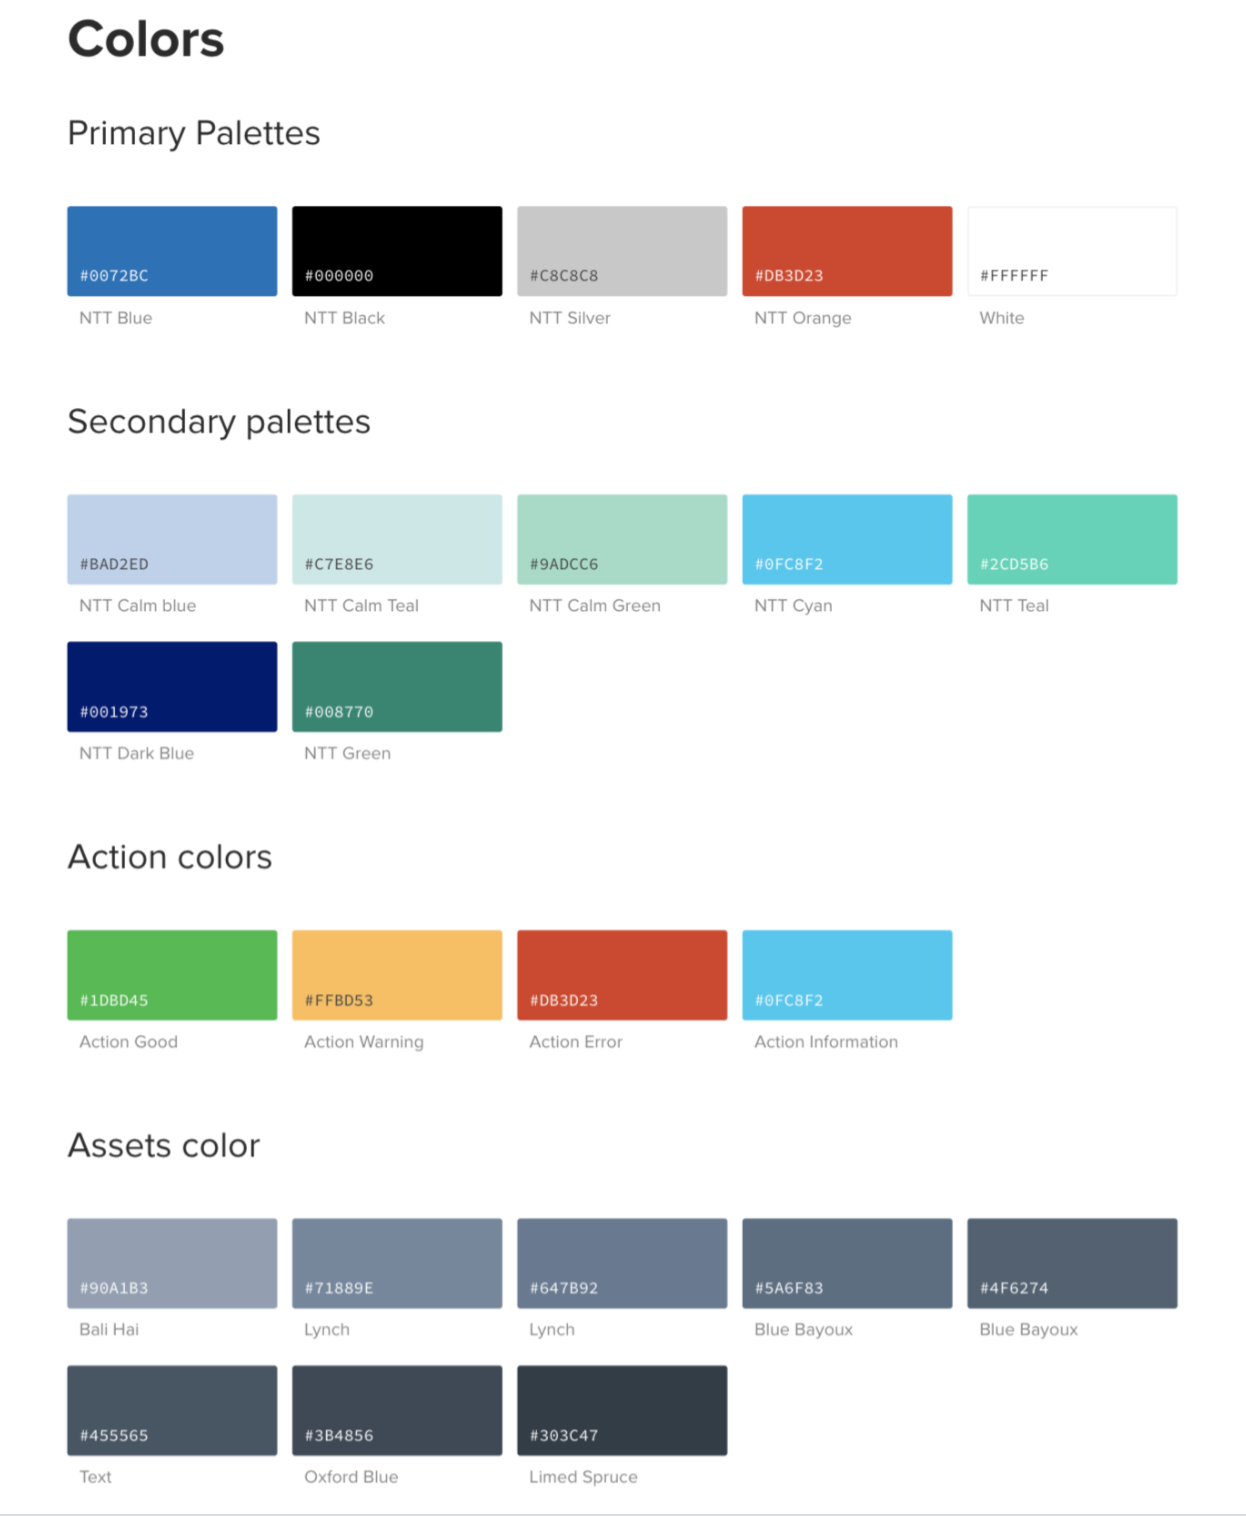
Built Design System Component Library of Light and dark themes.
Aligned with NTT's design system and drawing inspiration from Google's Material Design guidelines.


Learnings and Conclusion
As previously stated, this was an unusual project involving the iterative delivery of a solution continuously tested in real life. The solution is currently in use, and the improvements are likely to continue as more feedback is received.
One important and subtle lesson that I learned by working on the same requirement and revisiting it every few months with user feedback was this - the dashboard is not merely well-laid-out information. It is a tool meant to empower those that make decisions. Even small changes can make this more effective or user-friendly. There is always scope for improvement when we work closely with end users and understand their routine courses of action and ways of thinking.
The importance of usability across devices and fine-tuning text and titles for conciseness and precision was also underscored many times during this project.


